2,000 frustrated students. 202 survey responses. Inside a failing service design.
Current career fair logistics create a high-effort, low-reward imbalance for students. While students demonstrate extreme commitment—lining up as early as 7:00 a.m.—operational bottlenecks cut into time that could be spent making meaningful professional connections.
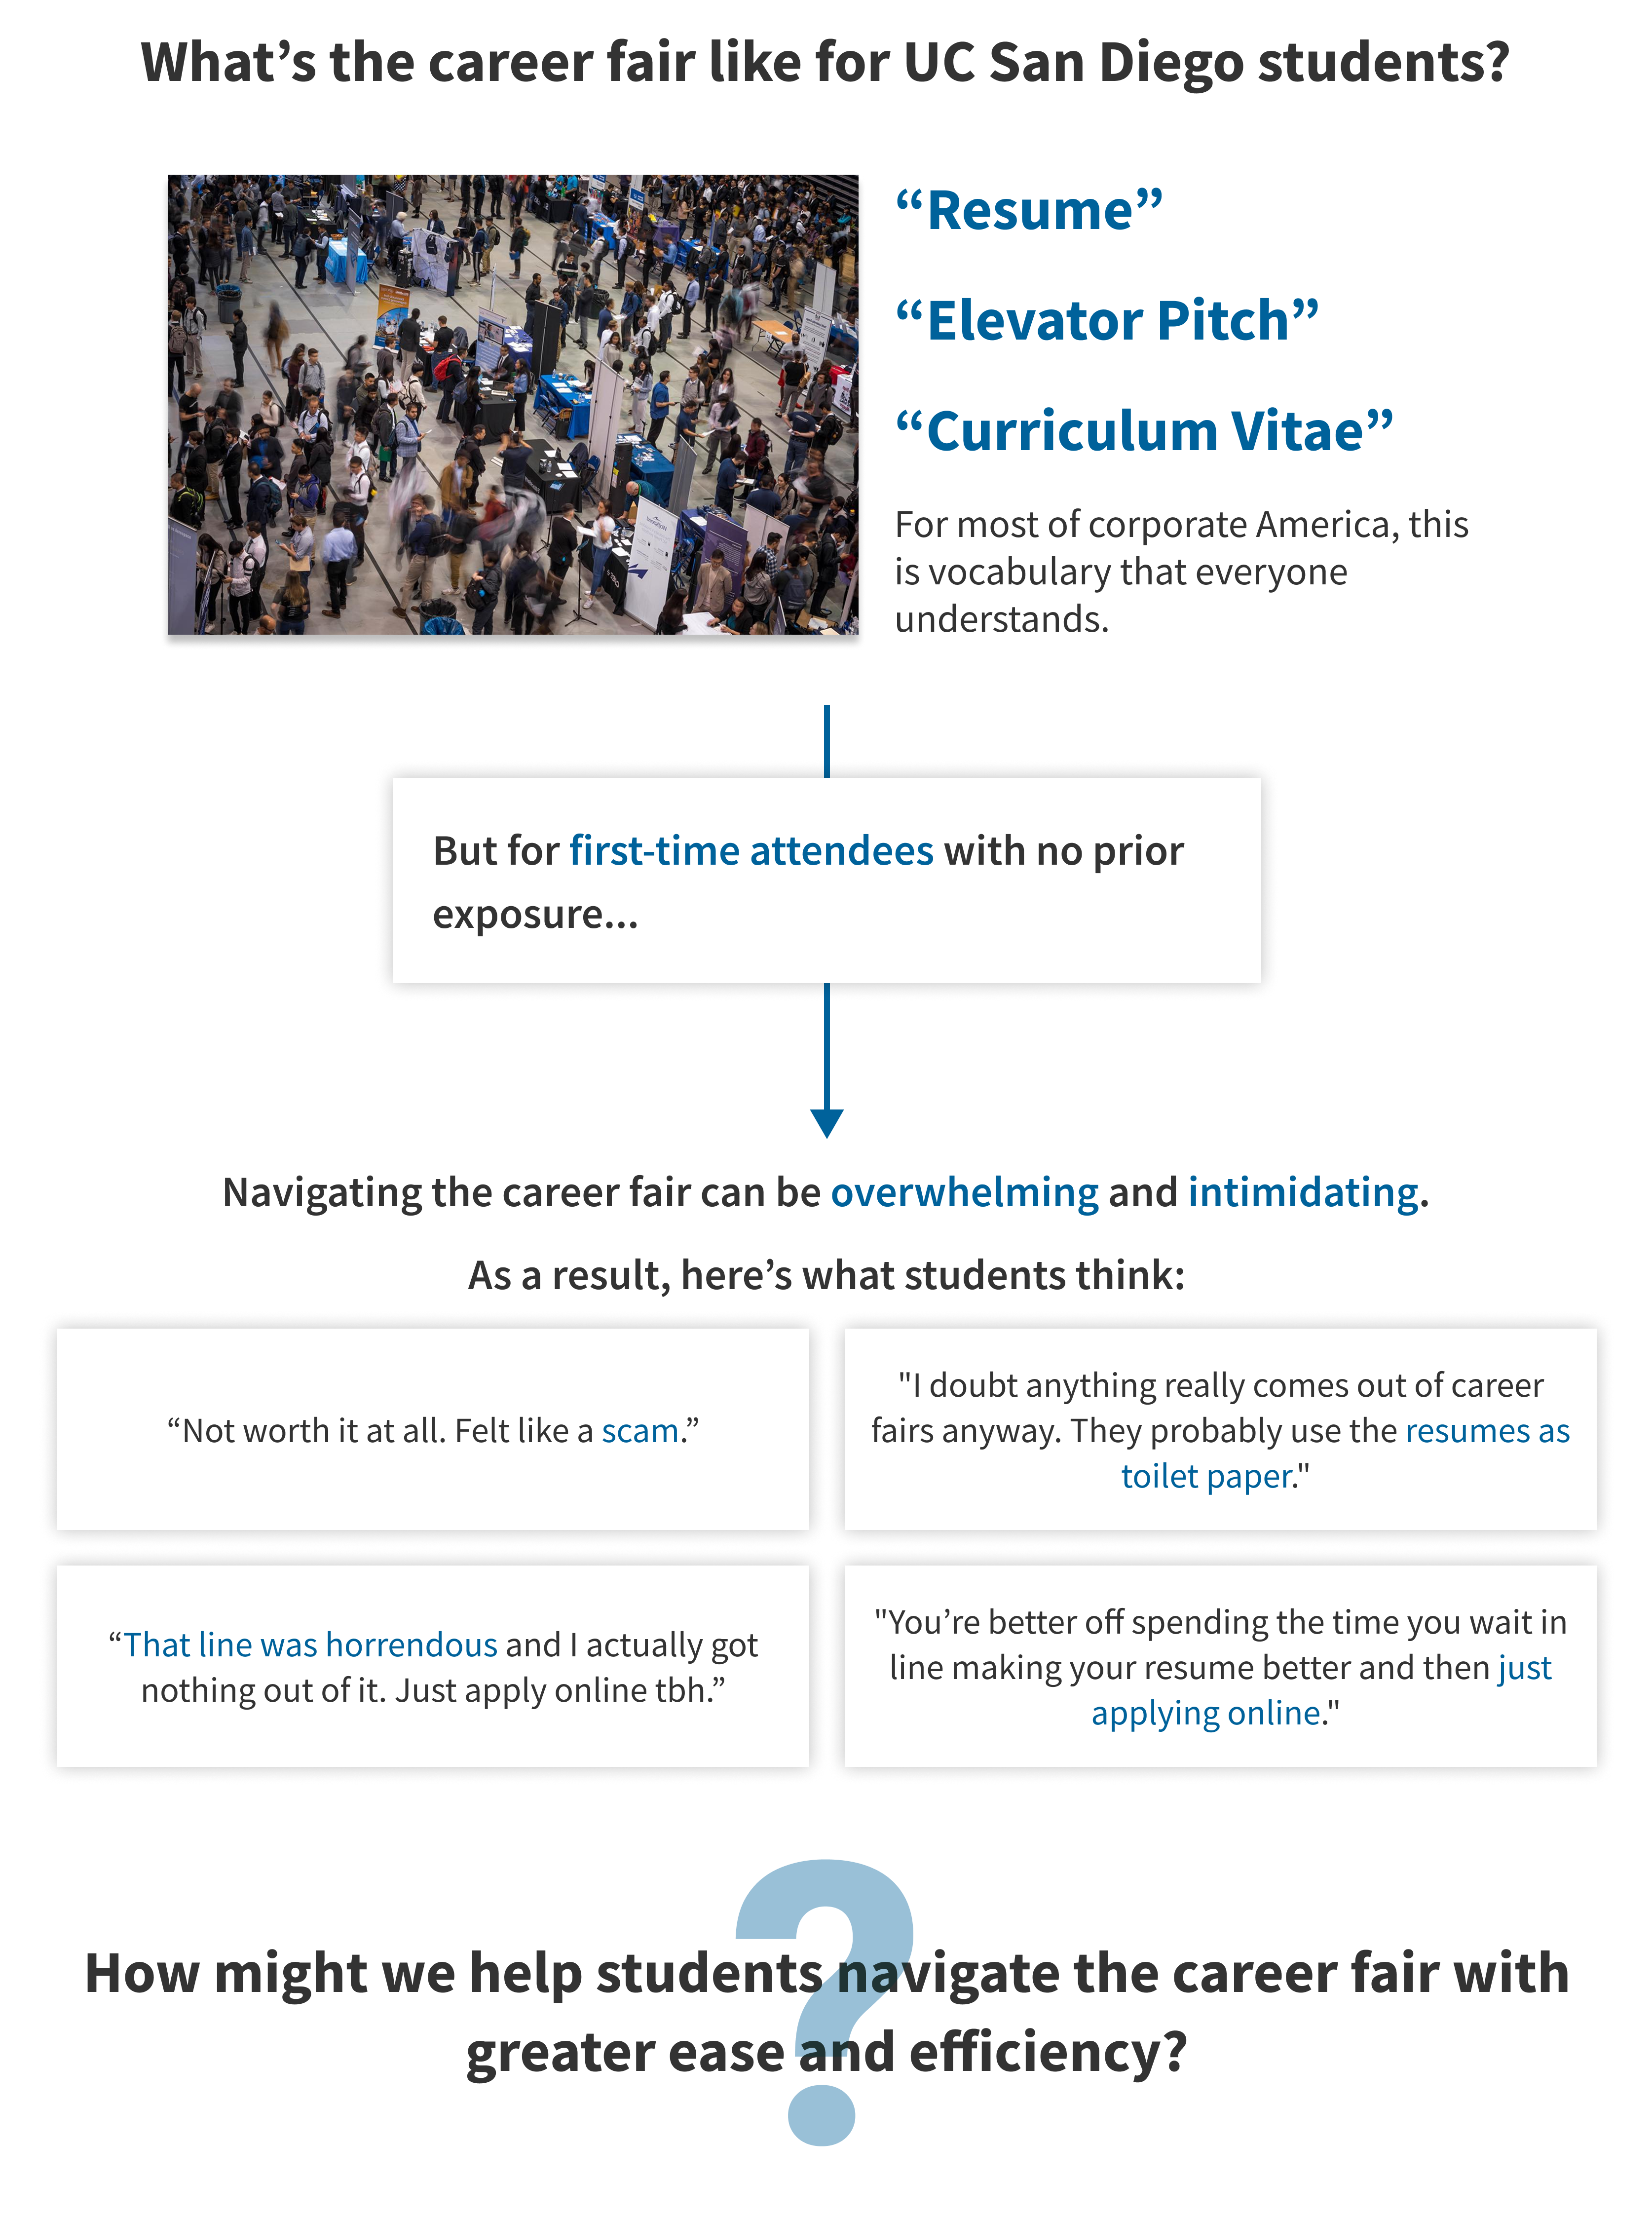
Every winter the Career Services Center holds a career fair, an event where almost 2,000 students can interact with potential employers and explore different career paths. For employers, the fair is an opportunity to recruit UC San Diego's top talent. In partnership with the Design Lab, I conducted a holistic diagnosis of the fair’s service design. I observed attendees, mapped the student journey through a service blueprint, and analyzed 202 survey responses using multiple linear regression to identify the core drivers of student satisfaction. My research revealed a broken ecosystem: 85% of student time is wasted in physical lines, resulting in a 41% "neutral" satisfaction rate and a 7-minute transaction that often ends in students questioning the event's value.
The Solution
While students expect a career launchpad, the data told a different story: a logistical gauntlet where 63% of attendees were navigating the fair for the first time. I delivered a research-backed roadmap to the Career Services Center—staggered entry systems to slash wait times and pre-event resume workshops to close the preparation gap—providing a scalable solution to transform student cynicism into success. The Center eventually implemented the entry system.
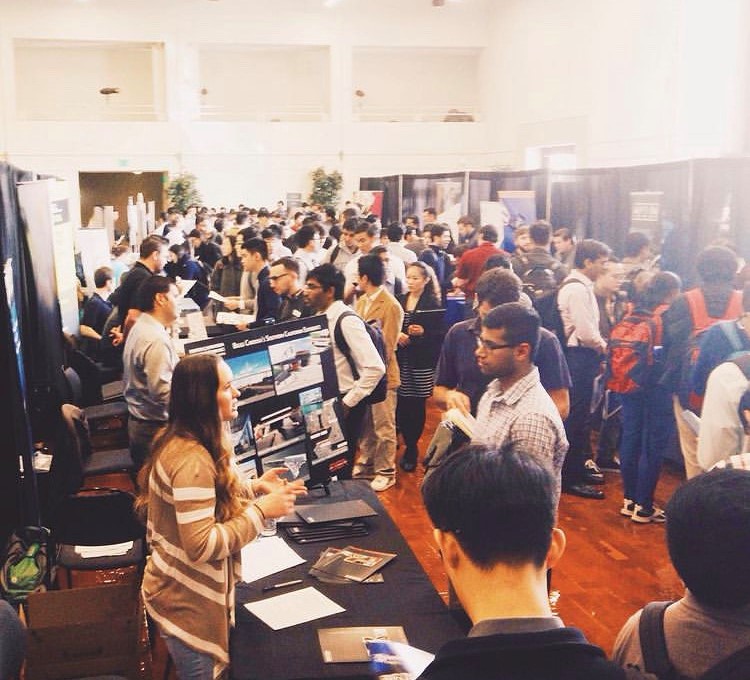
Capacity Strain: Nearly 2,000 students and over 70 companies, including IBM and Target, crammed into the Price Center Ballroom. At peak hours, the aisles were so crowded that students had to squeeze past those waiting in line to talk to recruiters.
Recruiter Rift: Larger companies like IBM and Target had 3+ recruiters and smaller ones only had one, creating stagnant zones in the fair’s flow.
The People: 7 a.m. to 7-minute Journey
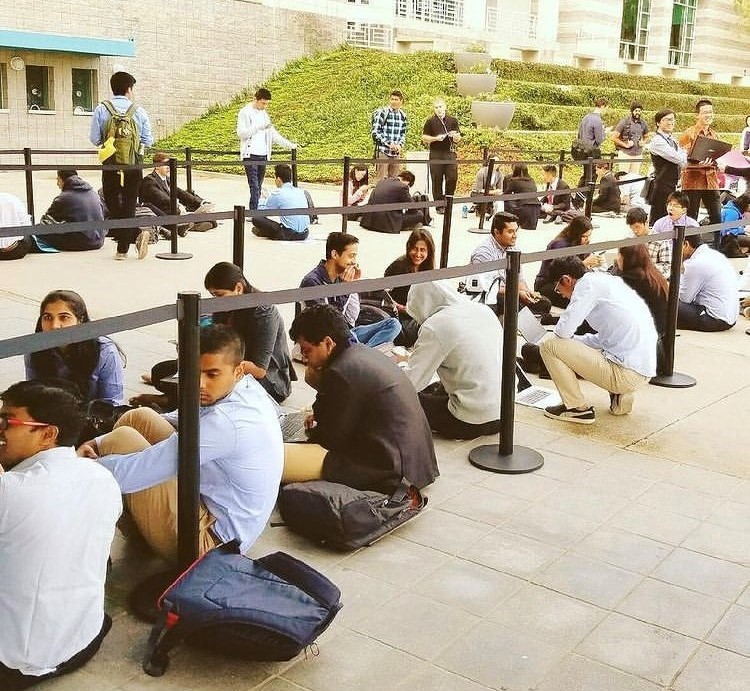
Early Bird Guarantee: Since interviews were on a first-come, first-served basis, students lined up early at 7 a.m. — the line spilling out of the ballroom, down the building steps, and snaking several yards outside.
Waiting Bottlenecks: Attendees faced a 40-60 minute entry wait followed by a 20-minute booth queue for every interaction.
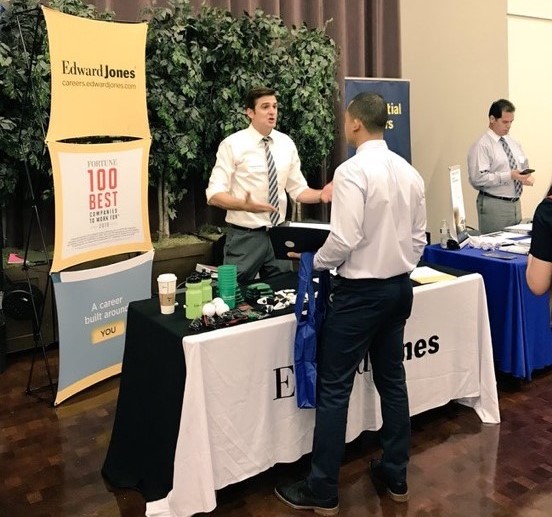
7-Minute Transaction: After hours of waiting, the average recruiter interaction lasted just 7 minutes. The interview was an assembly line: resume handoff, a few surface-level questions, and no clear next step.
Total Event Tax: Students visited an average of 3 employer booths. 85% of a student's time at the career fair was spent waiting in line.
Key Findings
Long wait times skewer the fair's value
85% of an attendee’s time at the career fair is spent waiting in line, draining them before ever meeting a recruiter. Students feel cynical after waiting two hours for a brief, low-value exchange.
The fair demands preparation it never provides
Without onboarding, 63% are flying blind. Students skip research, lack an elevator pitch, and—critically—burn their best energy on their top-choice employers rather than practicing on others first.
Scarcity turns networking into a competition
Too few recruiters and a small venue create a scarcity mindset. Students look at the crowds and think, "I'm just a number. I can't compete." This turns a networking opportunity into a psychological barrier.
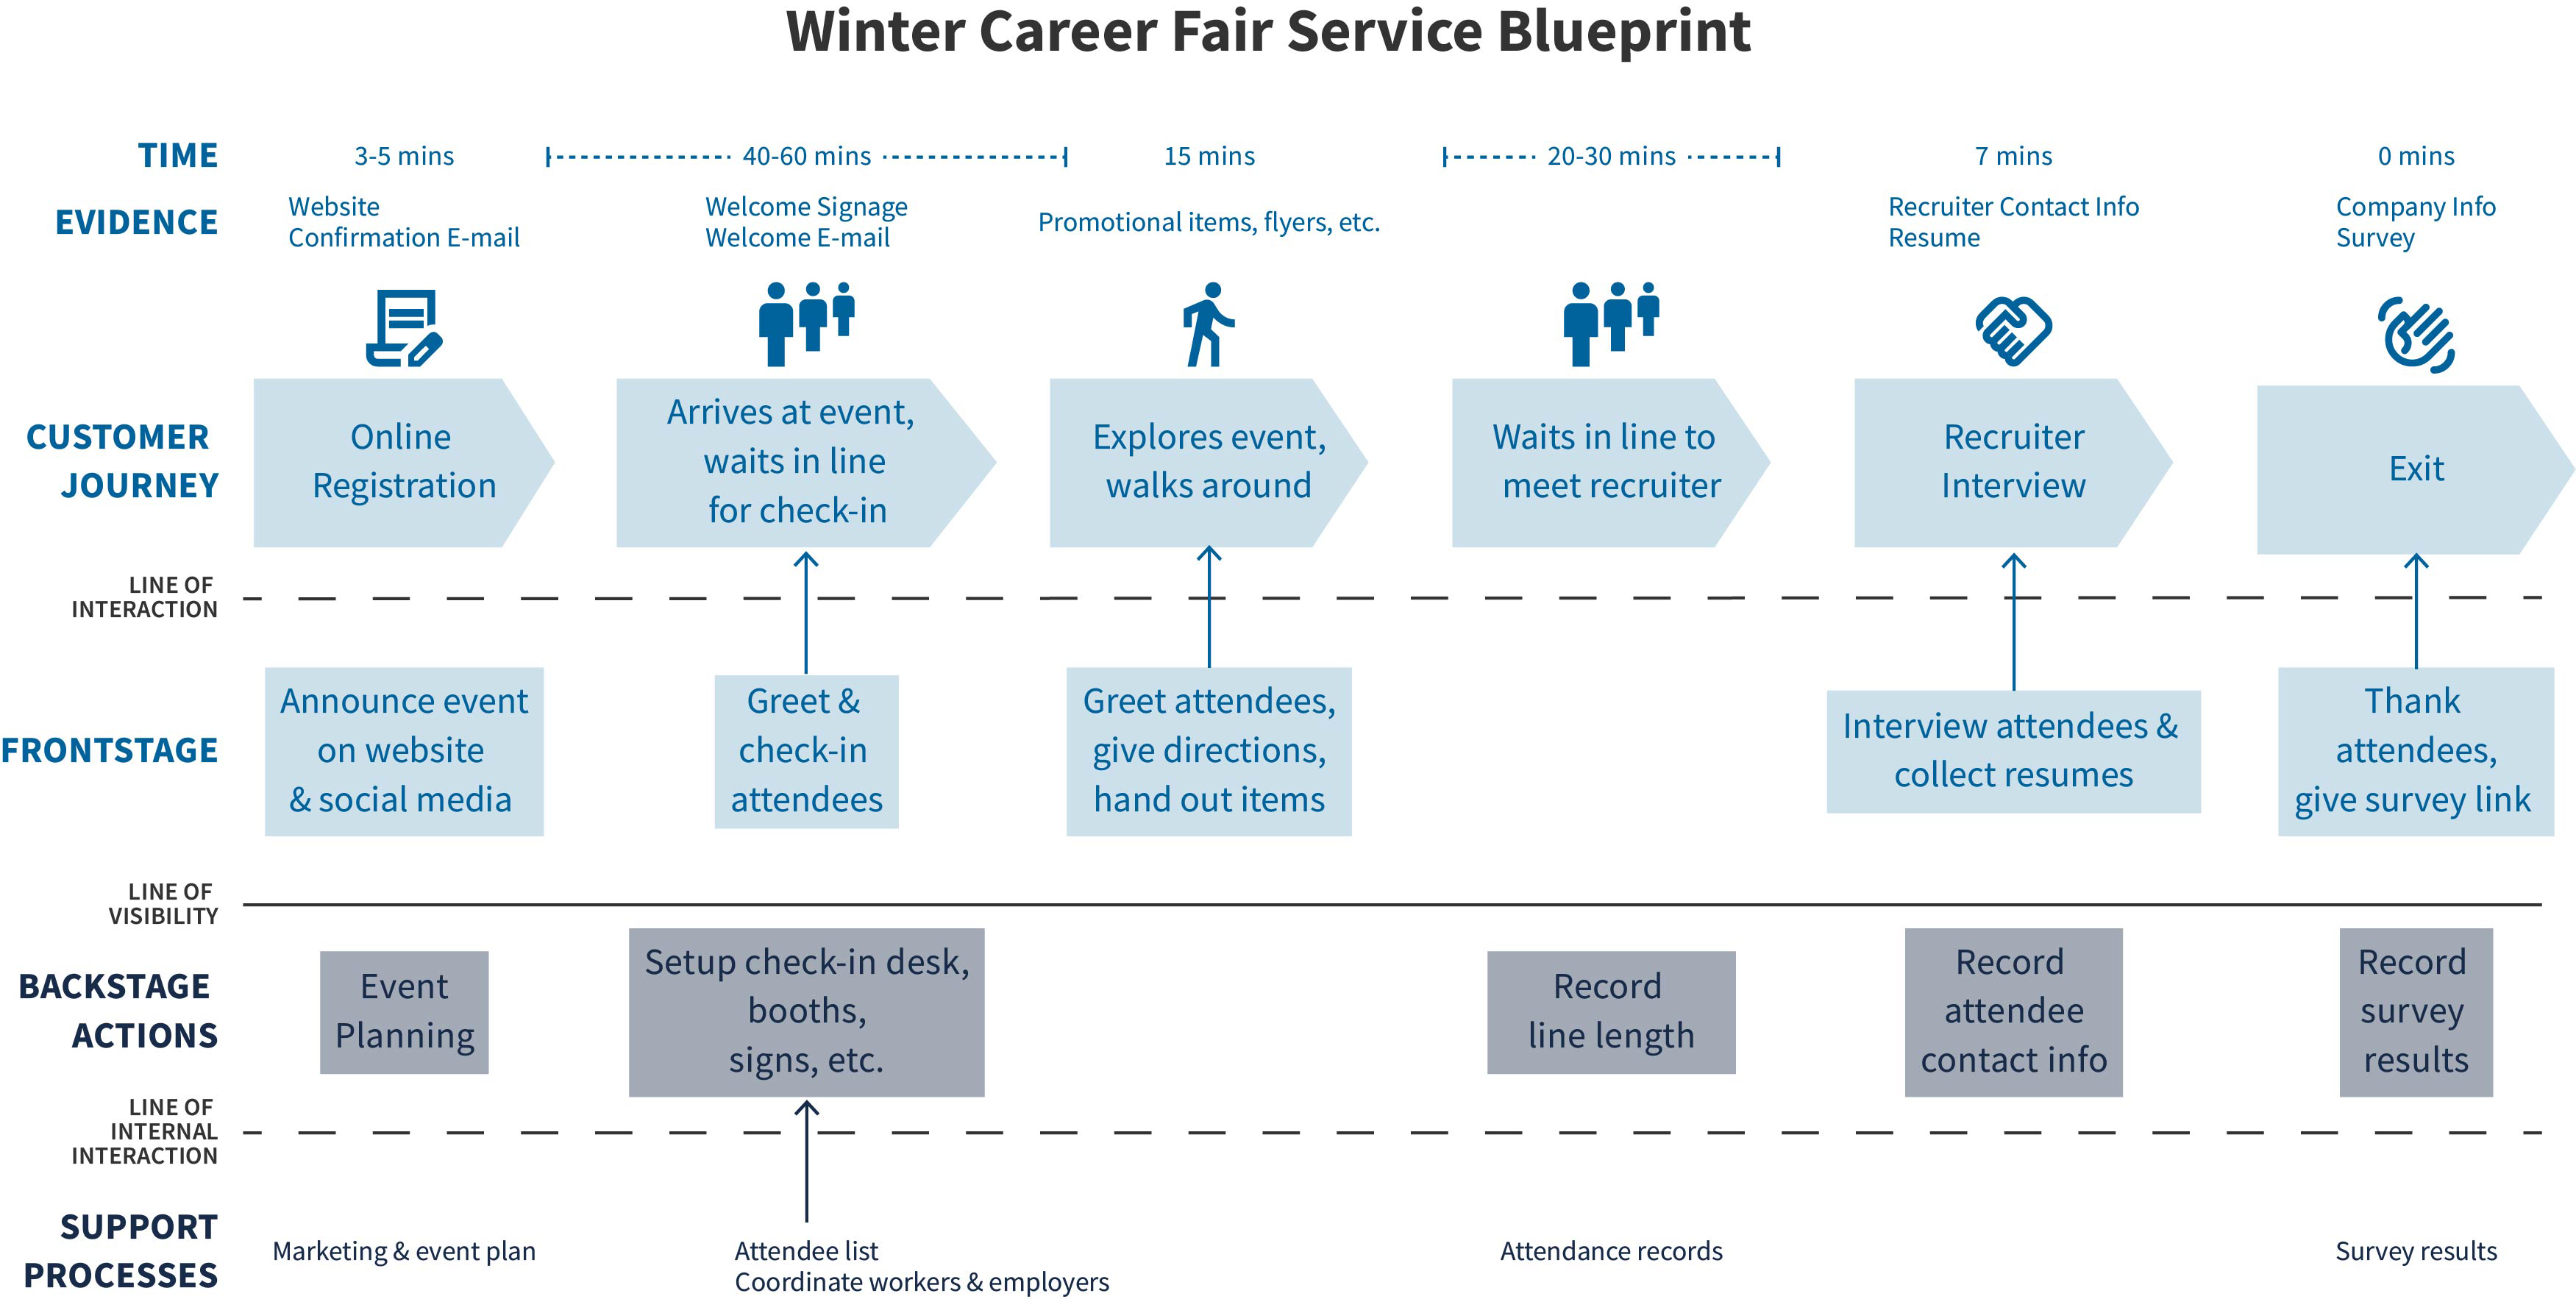
Service Blueprint
To assess the fair's service design, I mapped out the entire experience (web registration, check-in, recruiter interviews, etc.) with a service blueprint. Presenting it to stakeholders was the first step in making the case for change. The blueprint highlights how a student's journey builds up to a tiny 7-minute window. When students visit an average of only 3 booths, every minute spent in line is a lost opportunity for the Career Center to connect talent with employers.
Survey Results
The survey data revealed 2 main issues in the career fair experience:
First-timer Majority: Over 6 in 10 attendees are first-timers. Another 20% didn't even know the event existed, pointing to a communication failure on top of a service design failure.
Strategy Gap: Nearly half of attendees arrived without knowing what to expect—walking in with no pitch, no strategy. A third of students would like the Center to hold networking and resume workshops.
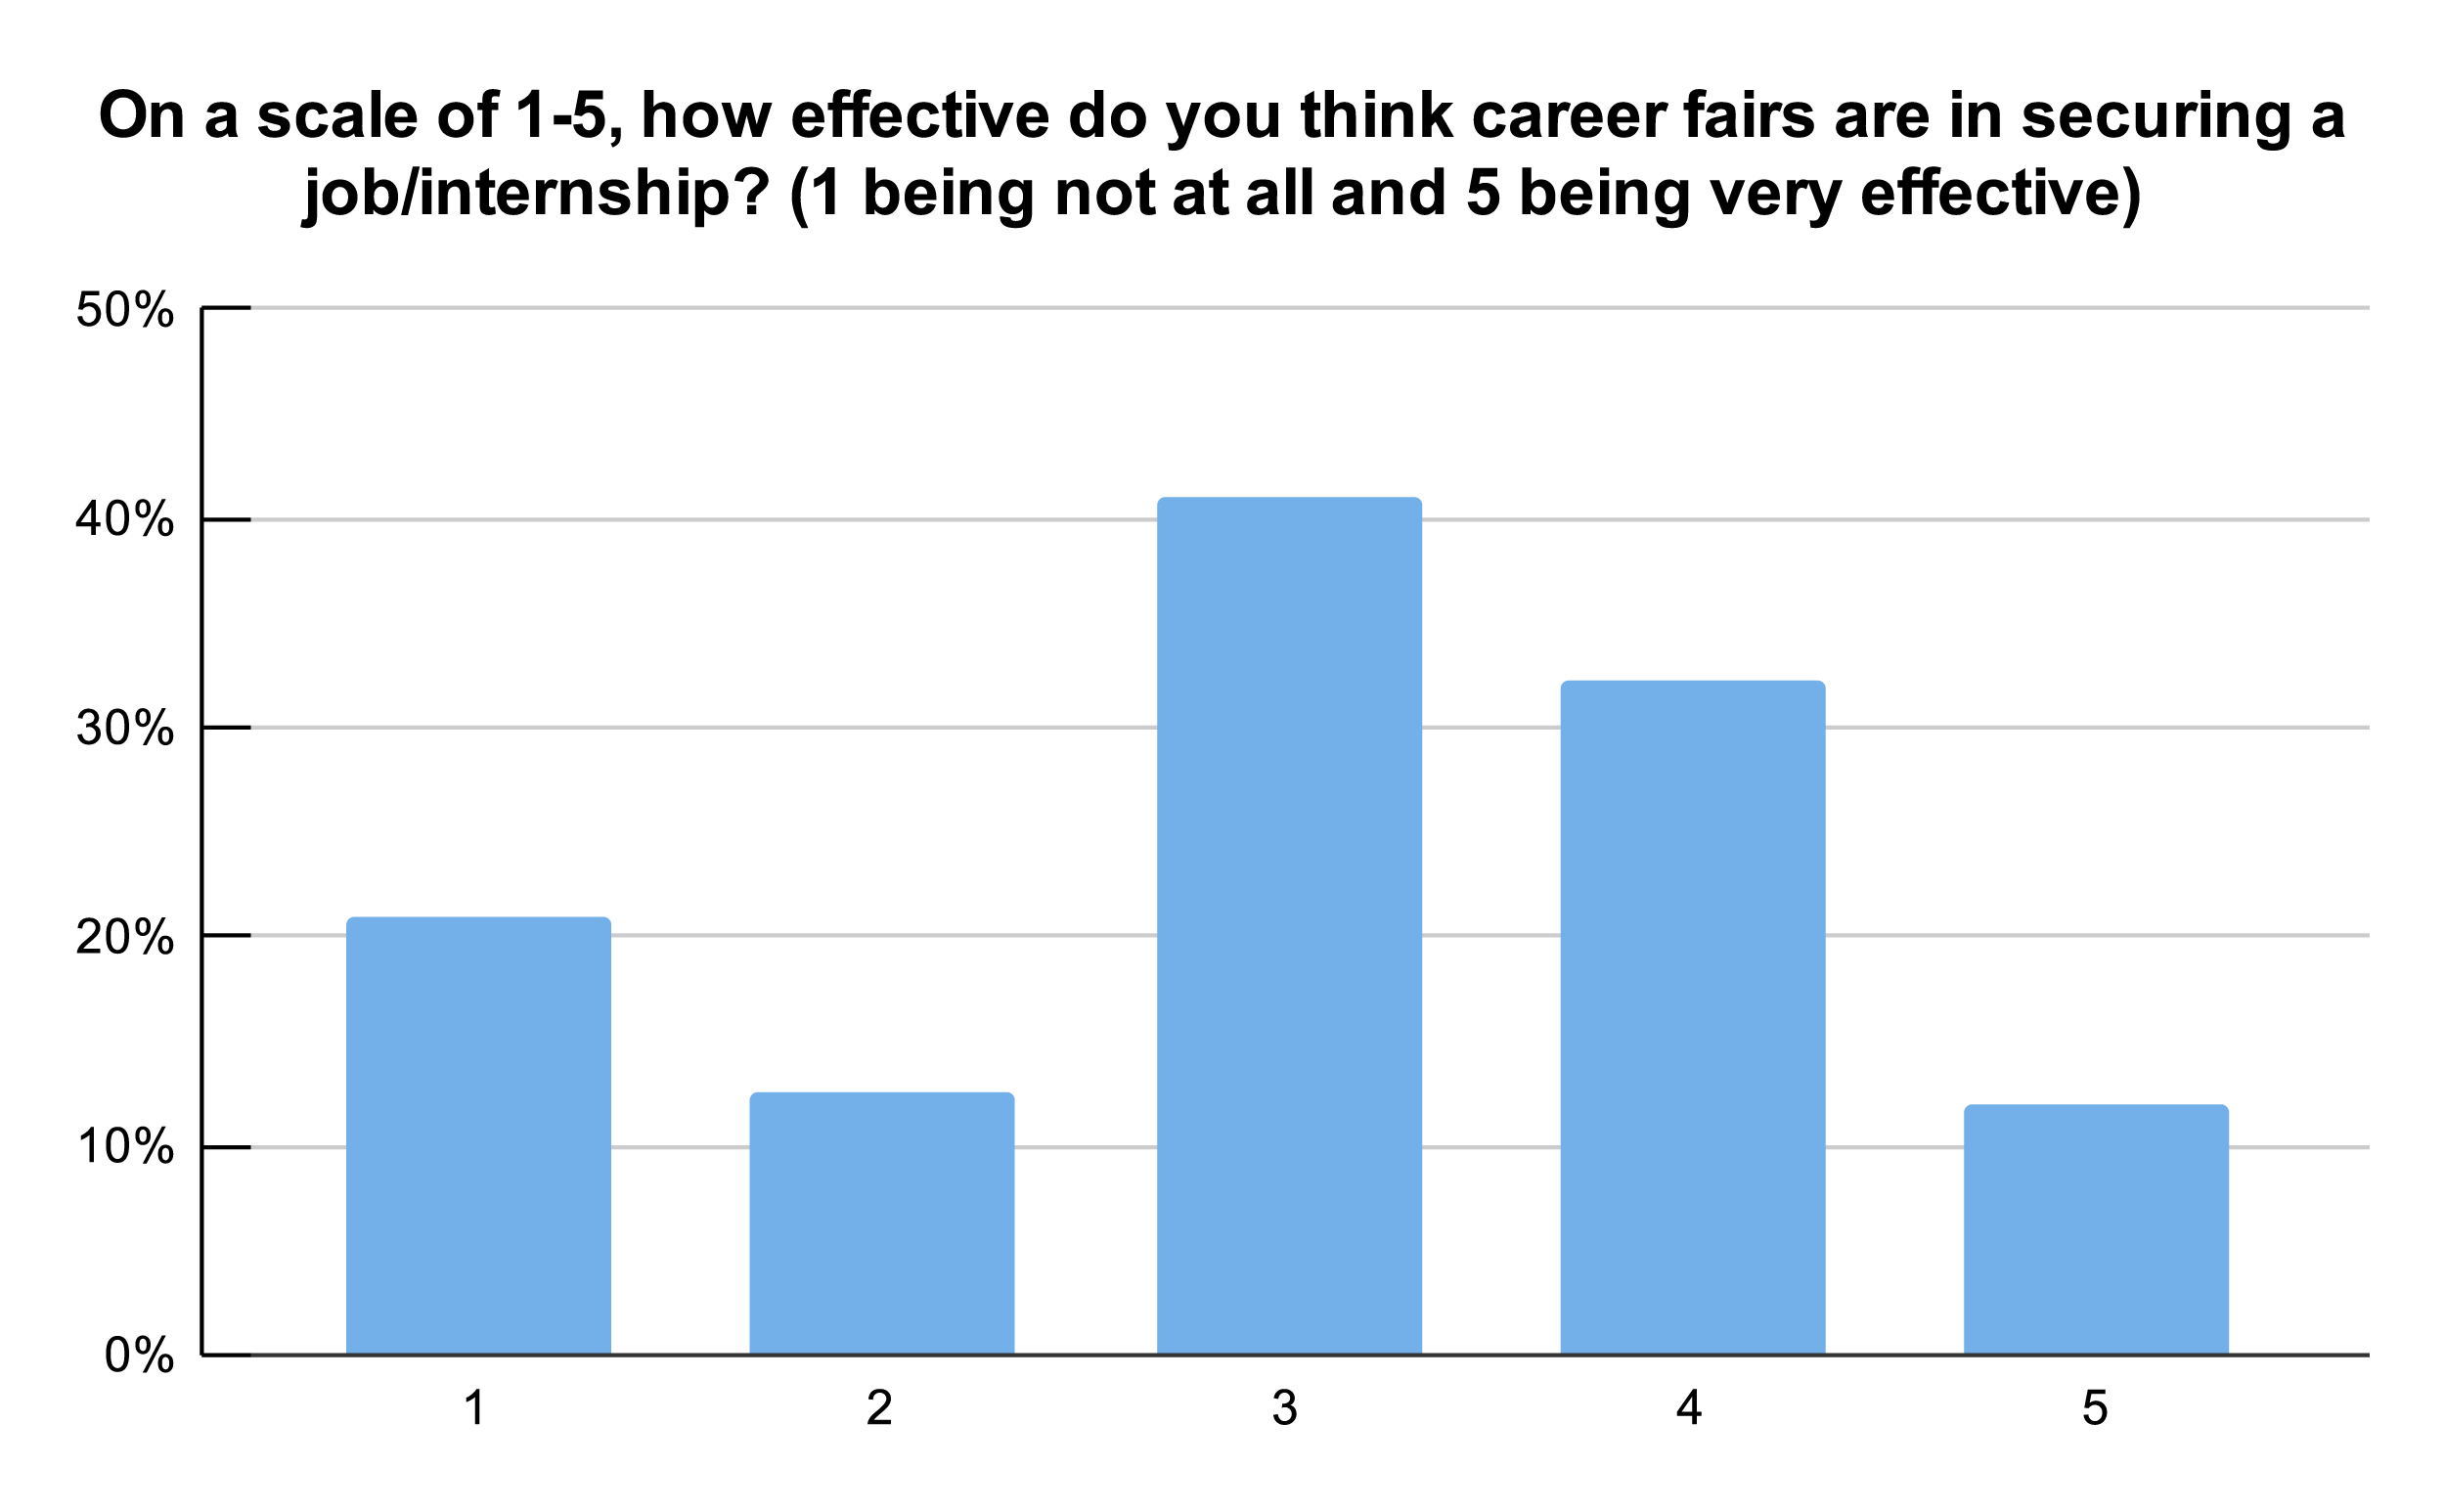
The most revealing question divided students into 3 camps:
👎21% — The Cynics
They spent the majority of the event standing still rather than networking. Their frustration is a logical response to a broken service design.
🤔 41% — The Undecided Middle
They invested significant time queuing but left without a definitive win — the largest, highest-leverage target for service recovery.
✅ 33% — The Opportunity
1 in 3 rated it very effective — proof the core service works when the conditions are right. A 68% margin for improvement remains.
I created an online questionnaire including 32 measurement items for career fair attributes and demographic questions using Qualtrics. Attendees were recruited to fill out the survey after leaving the fair. A total of 202 responses were collected. Career fair attributes were measured using a five-point Likert scale from 1 = Very Unimportant to 5 = Very Important and a performance scale from 1 = Strongly Disagree to 5 = Strongly Agree. Three measurements for student satisfaction were included in the questionnaire: "Overall, I am satisfied with the career fair," "Overall, I am pleased with my experience at the career fair," and "As a whole, I am happy with the career fair." Lastly, socio-demographic questions were added to identify participants’ gender, academic level, purpose for participation, and previous participation. Descriptive statistics were conducted to outline said demographics. Second, an exploratory factor analysis (EFA) was conducted with 32 career fair attributes to delineate the underlying quality dimensions of career fairs. Then, composite means of importance for each identified factor were also calculated to see the relative importance among the career fair factors. Lastly, the relationships between career fair factors and student satisfaction were investigated using multiple linear regression analysis.
41% rated the fair a 3 out of 5 — neither effective nor ineffective
43% of students wanted more information on what to expect; the strongest indicator for pre-event resources
Recommendations
Implementing these changes is a win for everyone. Students arrive prepared and confident. Recruiters spend their time on cultural fit and expertise instead of collecting basic information. And the Career Services Center fulfills its core mission: connecting UCSD's top talent with the right opportunities.
📋
Pre-Event: Close the Preparation Gap
Workshops, readiness checklists, and expectation-setting before students walk through the door — highest-leverage intervention available.
🤝
Day-Of: Turn the Wait Into a Win
Staggered entry system by graduation year turns a crowded gauntlet into a professional networking lounge. Students visit 6-8 employers instead of 3.
🚀
Future-State: From Gauntlet to Launchpad
A future appointment system replaces chaos with a guaranteed conversation, directly addressing the 52% of attendees looking for concrete career leads.
Lessons Learned
Rigid Frameworks Break in the Wild
Fieldwork forces us out of the lab's controlled setting and into the real world — where methods need to adapt on the fly as new phenomena reveal themselves. I dealt with issues like observer effects and equipment failure. I quickly learned the importance of being flexible, responsive, and adaptable to changing circumstances. Once you're bitten by the fieldwork bug, there's no going back!
No Follow-Up, No Ending
In hindsight, a follow-up survey after applying my recommendations would have let me measure the actual impact on student satisfaction. It's the metric I wish I had.