Overview
One hackathon. 3 months of meeting minutes. One AI-powered civic tool.
San Diego publishes open city data, but most of it sits in formats that require technical skills to navigate. It's information residents need to see how their city is working for them. In March 2026, I joined 60 builders at the inaugural Claude Impact Lab to change that. As the UX Designer, I conducted stakeholder interviews, defined target users, and advocated for features that broke down the barriers keeping civic data out of reach. In 8 hours, we built a civic intelligence dashboard that transforms months of bureaucratic records into plain-English themes, sentiment-coded visualizations, and an AI chat interface any resident can use.
The Problem
Every week, hundreds of San Diego residents speak at City Council. Voters show up but their voices get lost in the archives. Their words get filed away into meeting minutes — technically public, practically buried. The portal designed to provide this data assumes users come equipped with specialized training, technical vocabulary, and hours to spare. A simple question like "Is housing discussed more or less than last year?" requires a five-step research odyssey.
The Solution
Model Citizens ingests three months of City Council meeting minutes, strips the bureaucratic language, and makes them searchable by anyone — no research degree required. What used to take hours of manual research now takes a single query.
Role
UX/UI Designer
Duration
8 hours
Links
Tools
Claude 3.5 Sonnet, GitHub, Netlify
Research & Discovery
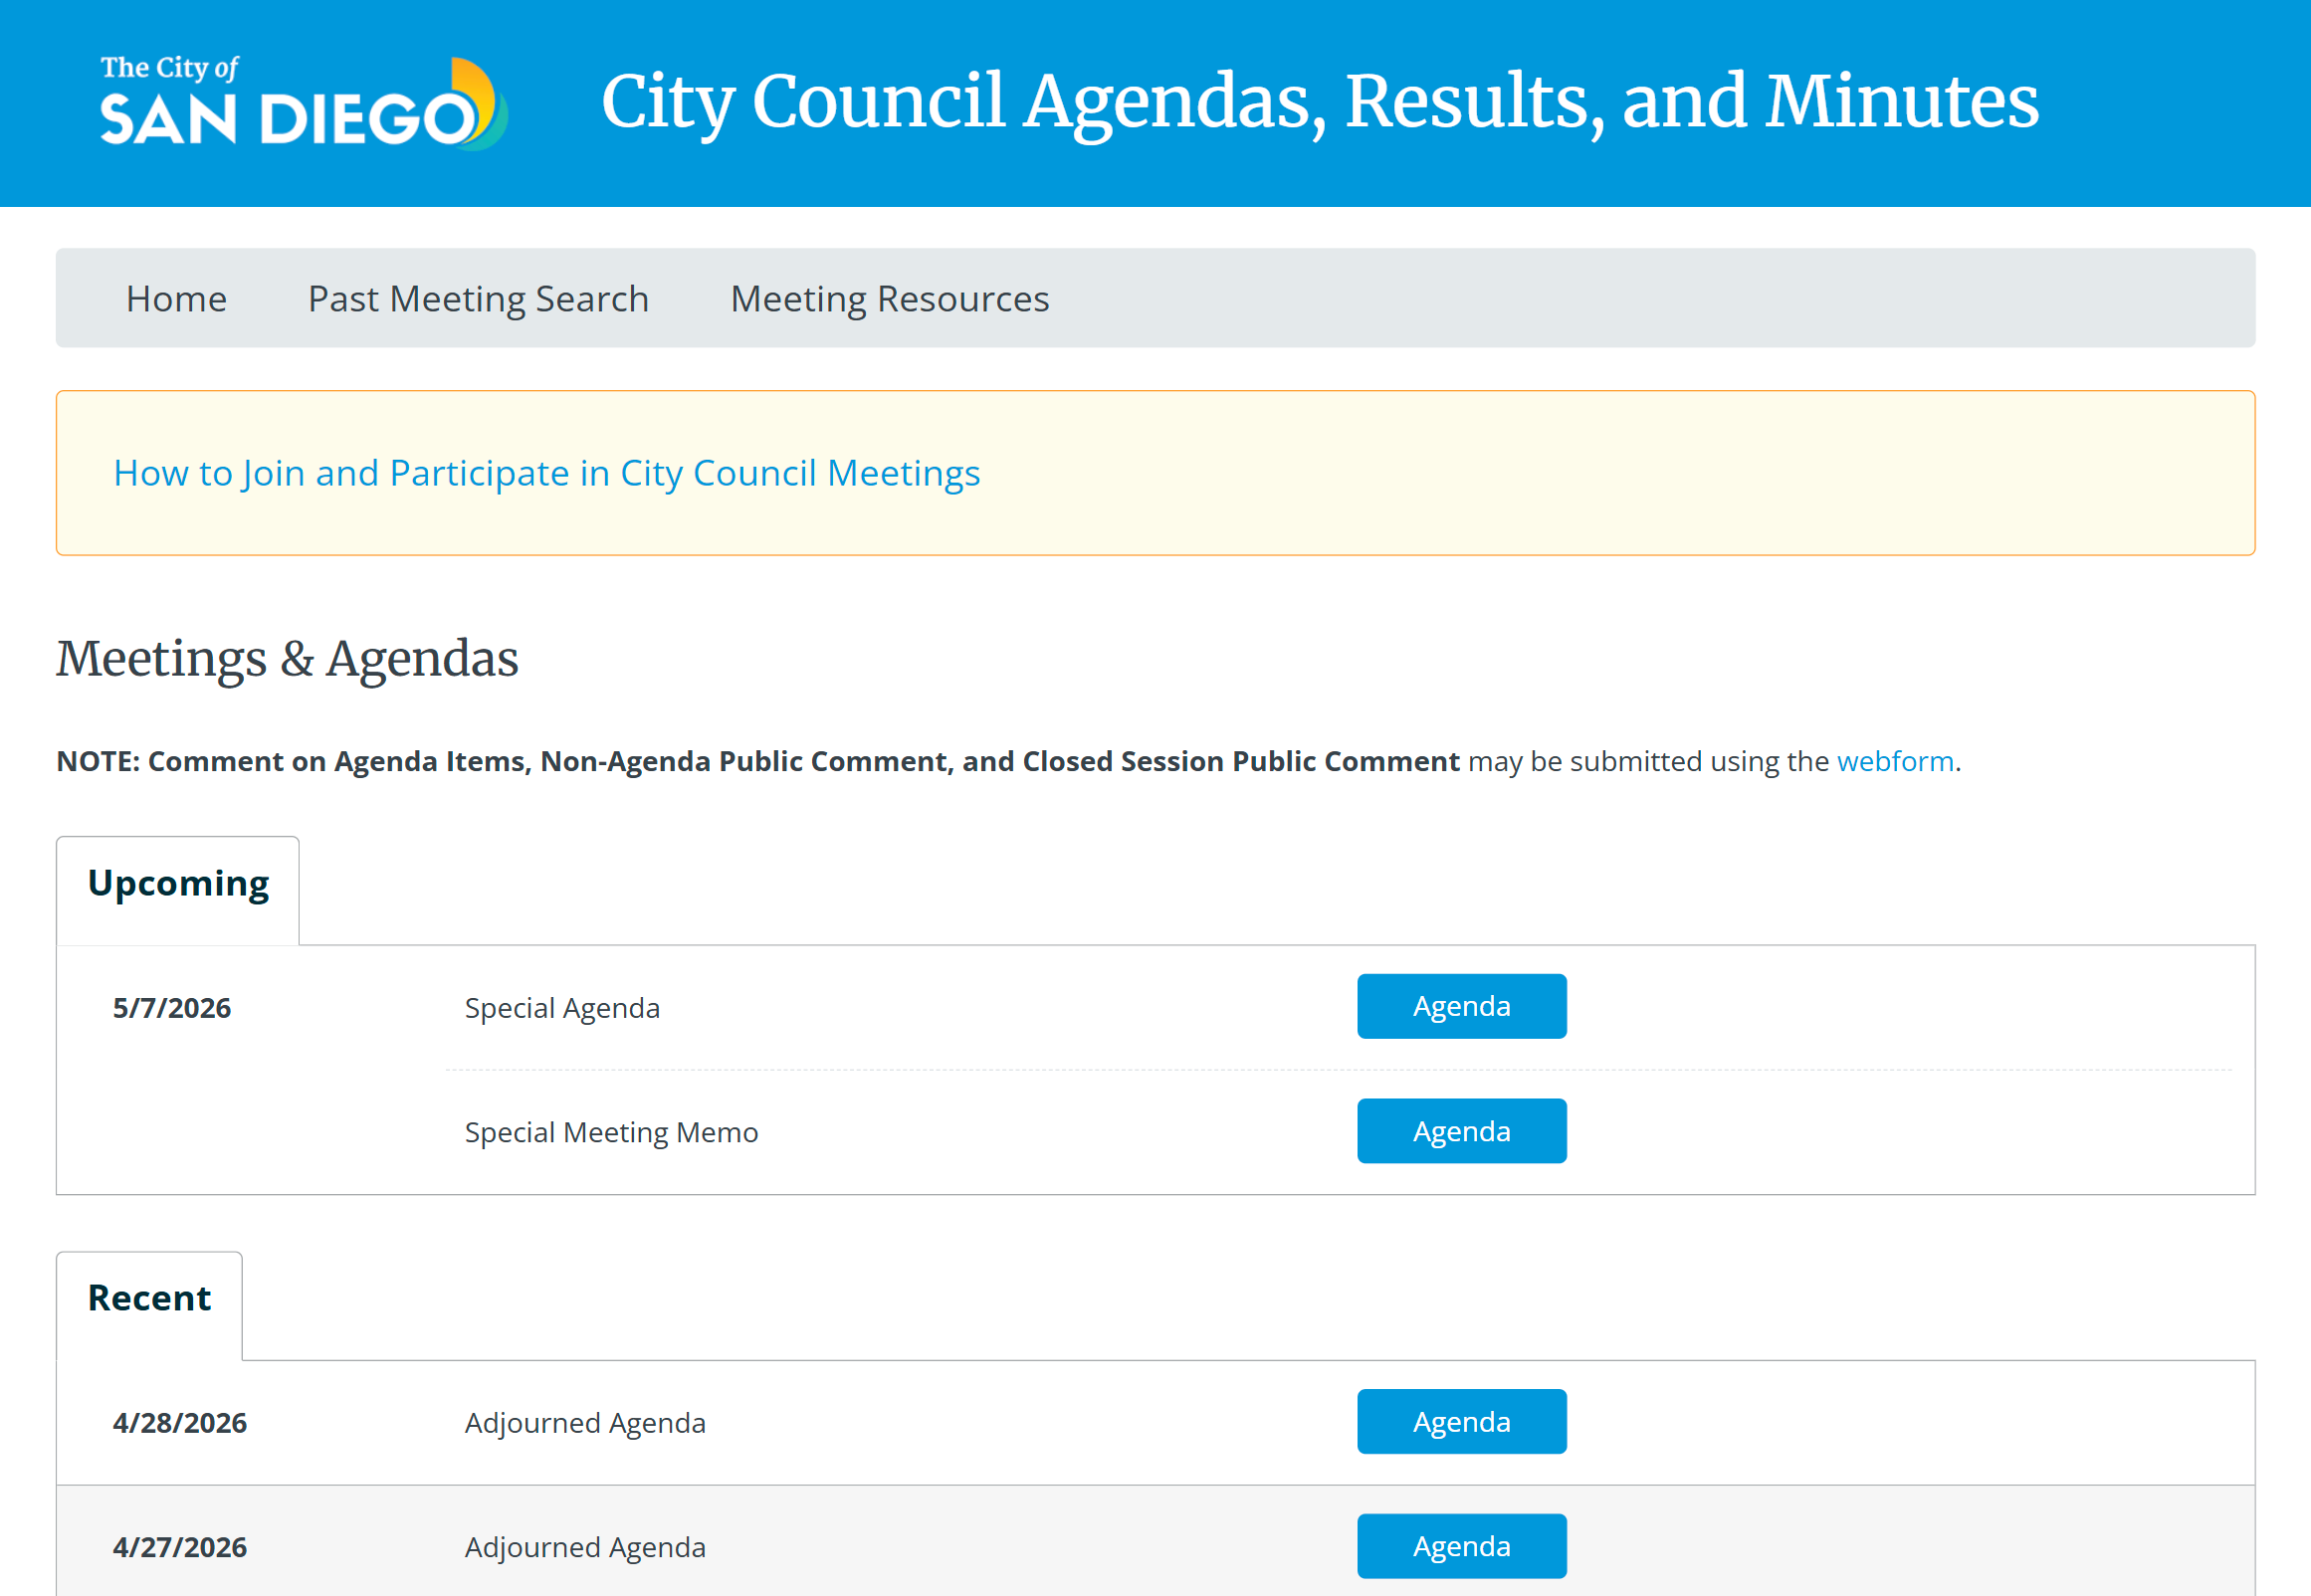
The Current Experience: A 5-step Research Odyssey
Without a centralized way to spot trends, residents are left navigating a portal where every meeting lives on its own page. No search, filtering, or way to compare across dates. If they want to understand the city's priorities, the only alternative is building a spreadsheet from scratch.
Stakeholder Interview
The event was organized by the City of San Diego's Chief Data Officer, which meant we had direct access to people who think about civic data access every day. Through an interview with a data official, I identified 3 existing user types:
🧑💻 Civic Technologists
No barrier
Private sector professionals who have the specialized training and dedicated time to parse complex data.
🏛️ City Employees
Low barrier
Range from analyst to department head — comfortable with terminology, charts and graph. Some able to perform their own analysis.
🫶 Nonprofit Employees
Low barrier
Use data to understand service efficacy or conduct demographic analyses to understand client needs. They're paid to do the research.
The city's portal was designed for technical experts, analysts, and professionals not the everyday San Diegan. A full-time worker, parent, or curious resident doesn't have hours to spare. Model Citizens was built to bridge this gap—democratizing access by shifting the interface from a specialized database to an intuitive, human-centered civic tool.
How might we transform a system that buries civic data into one that empowers residents to use it?
What We Built
Replace the 5-step Research Odyssey with a Single Query
Our dashboard ingests three months of San Diego City Council meeting minutes—between December 2025 and March 2026—strips the bureaucratic language, finds the patterns, and makes them visible. Each feature was designed to dismantle the two barriers identified in research: specialized training and time. The result is an active civic intelligence layer: a real-time monitor of shifting community priorities.
Clicking "What's the top issue?" provides a summary from months of meeting data.
Chat assistant
No training required. Just ask "What did residents say about housing?" and get a plain-English answer instantly.
Theme rankings
Public comments are automatically grouped into themes, ranked from the issue drawing the most attention down to the least.
Sentiment tags
Each theme is color-coded by sentiment so decision-makers get a read on the room not just a count of voices.
Real quotes
Surface actual quotes from actual speakers, not summaries. The human voice stays in the data.
Who It Helps
Designed for Every Kind of Civic Participant
Public information shouldn't require a research degree or technical skills. I mapped 3 user types, each with a different information need but the same core frustration: civic data is designed for bureaucrats. The mission was to give everyone the equal voice they deserve in our democracy by making civic engagement accessible and understandable.
🏘️ Residents
"I want to bypass bureaucratic jargon to see what my council actually spent time on, so I can show up to the next meeting informed."
📰 Journalists
"I want to automate the tracking of housing votes across months of meetings, so I can file a trend story before the news cycle moves on."
🫶 Advocates & Nonprofits
"I want a high-level view of agenda trends, like climate, so I can decide where to focus our next advocacy campaign."
Architecture
From Raw Minutes to Readable Insights
A weekly cron job scrapes agendas from San Diego's Hyland Cloud portal, stores them in a database, then sends them through Claude for theme grouping and sentiment analysis before surfacing results in the dashboard.
San Diego
Hyland Cloud
Source
Hundreds of meeting pages, agendas, PDFs, etc. trapped in a legacy portal.
scrapes
Weekly Scraper
Cron Job + Database
A scheduled job pulls fresh meeting minutes into structured data.
sends to
Claude 3.5 Sonnet
NLP + Sentiment Analysis
Groups comments into themes, reads sentiment, and powers the natural language chat interface.
surfaces
The Dashboard
Frontend + Chat UI
Theme rankings, sentiment tags, real quotes, and a chat assistant — one page any resident can understand.
Design Decision: Keep Humans in the Loop
Every AI output surfaces its source. The design choice was intentional: AI should boost trust in the data. Residents can always trace a theme back to the person who said it.
Data Sources & Integrity
San Diego City Council Agendas & Minutes
We chose to scrape directly from the Hyland Cloud Portal to ensure the dashboard remains a Primary Source tool. By pointing back to the original source, we maintain the trust required for civic tech.
What I'd Do Next
8 hours was just the beginning. Here's what I would do next:
Lessons Learned
Designing for AI: Trust is a UI Requirement
Working with the Claude API taught me that designing for AI is different from traditional UI. In order for a resident to trust an AI-generated summary of a city council vote, they need a receipt. In the age of AI, the designer’s primary job is to build the trust chain between the algorithm and the end user.
Pressure as a Design Tool
Working alongside engineers under tight constraints taught me how to communicate design decisions quickly and pivot when technical feasibility shifted the scope. To cut through the noise, I defined users before touching the interface—keeping the team aligned and proving that pressure is one of the most effective filters for focus a designer can have.
Civic UX is Not Consumer UX
Civic UX means slashing bureaucratic jargon like meeting codes and legal terms to create an interface any resident can scan in 60 seconds. Unlike the private sector, civic tech can't afford to lose clarity or erode trust. Building a dashboard a skeptical resident would trust took deliberate design decisions at every layer. A disengaged resident is one less voice heard.